Alberta oil sands production mine: glovis 42/20
RECLASS IDRISI:
Above are the products of a simple classification scheme using Idrisi Selva’s Cluster tool (Figure 3-1). The maps created above used bands 1,2,3,4,5, & 7 to create a 16 class display. Those 16 classifications were compared against true and false color scenes of the study area and each class was given a value of Bare Earth, Forrest, Cleared/Grassland, and Water.The 16 classes were sufficient to provide a visual trend of the development in the area. It is important to note that climatic factors may contribute to the appearance of vegetation.The area calculations for each classification are not to be taken as precise measurements, but rather as trending numbers (Chart 3-1). False color images, for example bands 4,5,3, can be used to create a visual depiction of the land cover changes (Figure 3-2) and when shown in contrast of a true color image of native land cover the mining impact is very pronounced (Figure 3-3).
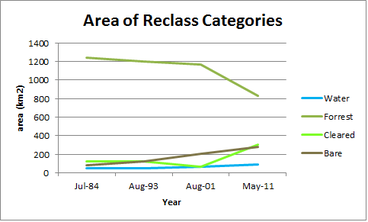
Table 3-2: Trend in land cover from image reclass function
Comparison Imagery for reclass
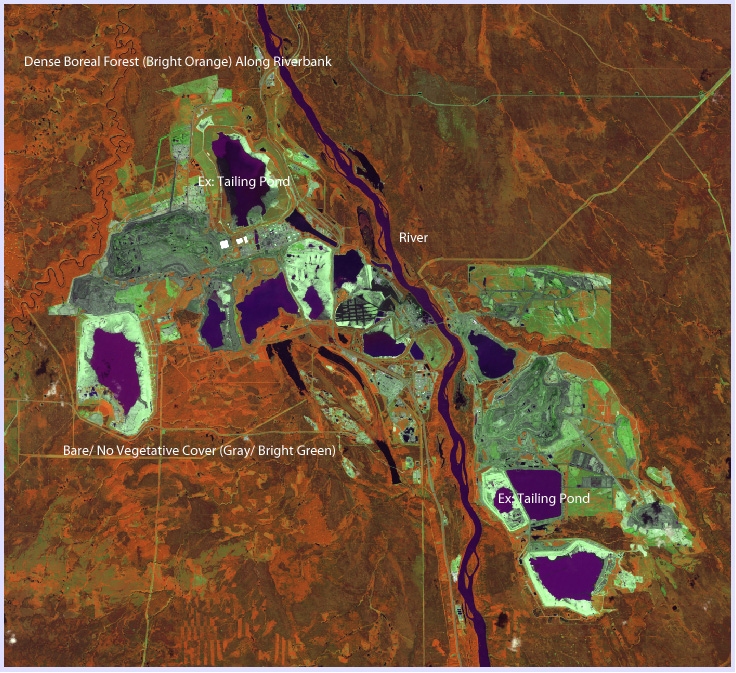
Figure 3-2: July 2011: Bands 4, 5 and 3 (Created in Idrisi)
|

Figure 3-3: West of Original Mine Site (Google 2011)
|
